About Chalk
What?
Chalk is a platform that transforms complex educational content into beautiful, organised visuals. Our tools help teachers create organised materials that enhance student understanding and retention.
This app is being developed with teachers in the Primary Task Design Community founded by Karl McGrath. Join the group to explore innovative task design ideas.
Example Diagrams
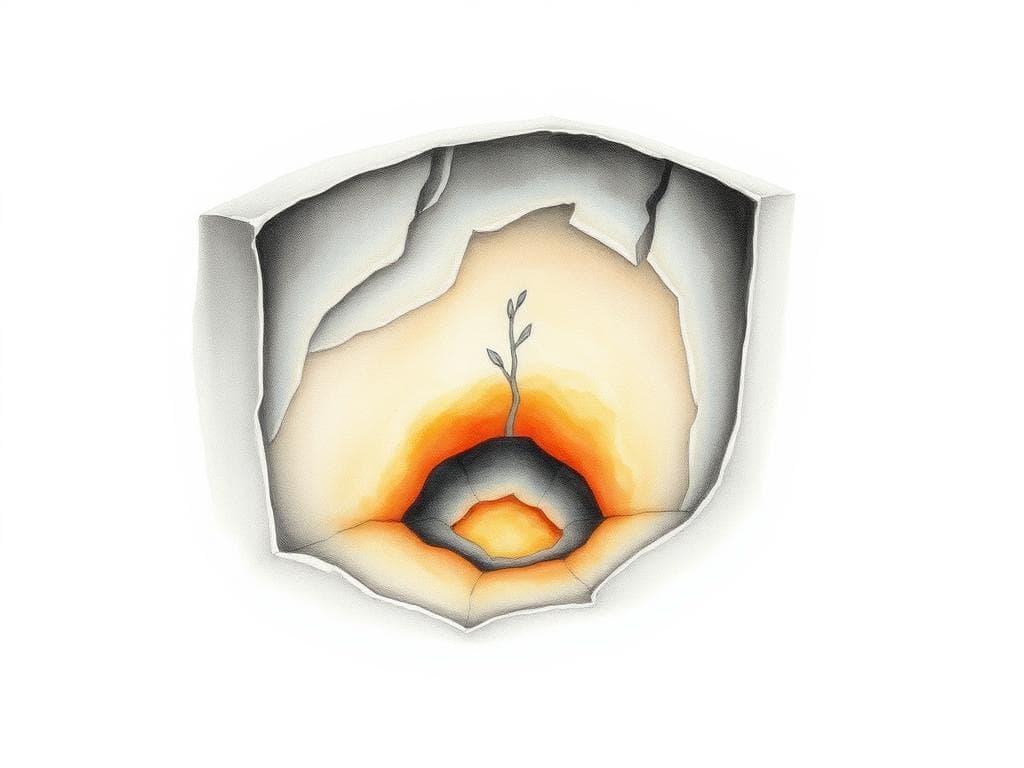
Volcano Formation
Sequential visual explanation of how volcanoes form and erupt


Why?
Visual diagrams dramatically improve learning outcomes. Research shows they enhance retention, strengthen schema formation, and increase accessibility for diverse learners.
Loading mind map visualization...
The Learning Science Behind Visual Diagrams in Education
Visual diagrams like mindmaps, concept maps, grids, Venn diagrams, and storyboards are powerful educational tools with extensive research supporting their effectiveness. These tools are particularly valuable for students with Special Educational Needs and Disabilities (SEND), though they benefit all learners. Research demonstrates three key benefit areas:
Better Retention of Information
Visual diagrams significantly improve students' ability to remember and recall information through multiple mechanisms:
Dual Coding
Research by Paivio (1971, 1986) established that when information is processed through both visual and verbal channels simultaneously, retention improves dramatically. This "Dual Coding Theory" explains why combining text with visual elements creates multiple neural pathways to the same information, strengthening memory formation.
Reduced Cognitive Load
Visual organization offloads memory demands, freeing mental resources for deeper processing. Clark et al. (2006) demonstrated that external visual representations function as memory aids, reducing working memory demands that can otherwise overwhelm students, particularly those with SEND.
Active Processing
When students engage with visual diagrams, especially when creating them, they process information more deeply. Moreno & Mayer (2007) found that this active engagement leads to better encoding and retrieval of information compared to passive reading of text.
Stronger Schema Formation
Visual tools help students build robust mental frameworks that organize knowledge in meaningful, retrievable ways:
Concept Connections
Novak & Cañas (2008) showed that visual diagrams explicitly demonstrate relationships between ideas, helping students construct integrated knowledge networks. This is particularly valuable for complex topics where relationships between concepts are crucial for understanding.
Hierarchical Organization
Visual structures illustrate knowledge hierarchies and classifications, helping students organize information logically. Ausubel's (1968) research on meaningful learning demonstrated that new information is best understood when it can be incorporated into existing knowledge frameworks.
Information Chunking
Breaking complex concepts into manageable units aids comprehension and retention. Sweller et al. (2019) observed that visual diagrams support this chunking process naturally, making even sophisticated concepts more approachable, especially for students who struggle with cognitive processing.
Higher Accessibility for Diverse Learners
Visual diagrams make learning more accessible to students with diverse needs and learning profiles:
Dyslexia Support
Students with dyslexia benefit substantially from reduced text through visual organization. Mortimore & Crozier (2006) found that visual diagrams help dyslexic students bypass text-processing difficulties while still engaging with complex content.
ADHD Support
For students with attention difficulties, visual diagrams provide structure that helps maintain focus. Rappolt-Schlichtmann et al. (2013) demonstrated that diagrams breaking information into manageable chunks helped students with ADHD organize their thinking and sustain attention on learning tasks.
Visual Strengths Leverage
Many students with autism have significant visual processing strengths that diagrams effectively leverage. Grandin (2006), herself on the autism spectrum, has documented how visual thinking can be a powerful mode of learning and expression for autistic individuals.
Applications Across Educational Contexts
Different diagram types benefit different learning situations:
- Concept maps help students connect ideas and see relationships (Novak, 2010)
- Mind maps support brainstorming and creative thinking (Buzan & Buzan, 2010)
- Venn diagrams explicitly show similarities and differences (Ritchhart et al., 2011)
- Storyboards help with sequencing and narrative understanding (Dye, 2000)
Research by Dexter & Hughes (2011) found that these visual organizers improve factual recall, vocabulary knowledge, and reading comprehension for students with learning disabilities.
Visual representations are particularly important in STEM subjects where abstract concepts can be difficult to grasp (Cromley et al., 2016). Technical diagrams help students visualize processes, structures, and relationships that might otherwise remain abstract.
This approach aligns with Universal Design for Learning principles (CAST, 2018), which emphasize providing multiple means of engagement, representation, and action/expression to make learning accessible to all students.
References
- Ausubel, D. P. (1968). Educational psychology: A cognitive view. Holt, Rinehart and Winston.
- CAST (2018). Universal Design for Learning Guidelines version 2.2. http://udlguidelines.cast.org
- Caviglioli, O. (2019). Dual Coding With Teachers. John Catt Educational.
- Caviglioli, O. (2023). Organising Ideas: The Visual Transformation of Understanding. John Catt Educational.
- Clark, R. C., Nguyen, F., & Sweller, J. (2006). Efficiency in learning: Evidence-based guidelines to manage cognitive load.
- Cottinghatt, S. (2023). Ausubel's Meaningful Learning in Action. John Catt Educational.
- Dexter, D. D., & Hughes, C. A. (2011). Graphic organizers and students with learning disabilities: A meta-analysis. Learning Disability Quarterly, 34(1), 51-72.
- Grandin, T. (2006). Thinking in pictures: My life with autism (Expanded ed.). Vintage.
- Mayer, R. E. (2009). Multimedia learning (2nd ed.). Cambridge University Press.
- Moreno, R., & Mayer, R. (2007). Interactive multimodal learning environments. Educational Psychology Review, 19(3), 309-326.
- Novak, J. D., & Cañas, A. J. (2008). The theory underlying concept maps and how to construct and use them. Technical Report IHMC CmapTools.
- Paivio, A. (1986). Mental representations: A dual coding approach. Oxford University Press.
- Rappolt-Schlichtmann, G., Daley, S. G., & Rose, L. T. (2013). A research reader in universal design for learning. Harvard Education Press.
- Ritchhart, R., Church, M., & Morrison, K. (2011). Making thinking visible: How to promote engagement, understanding, and independence for all learners. Jossey-Bass.
- Sweller, J., van Merriënboer, J. J. G., & Paas, F. (2019). Cognitive architecture and instructional design: 20 years later. Educational Psychology Review, 31(2), 261-292.
At Chalk, we follow key design principles to ensure our visual learning materials are both beautiful and effective:
Clarity First
Visual elements should simplify understanding, not complicate it. We prioritize clear communication over decoration.
Reduce Cognitive Load
Diagrams should offload mental effort, not add to it. We carefully balance information density to avoid overwhelming students.
Meaningful Structure
Spatial organization should reflect logical relationships. Position, size, and grouping all contribute to understanding.
Essential Content Only
Every visual element should serve a purpose. We ruthlessly edit to focus on what truly matters for learning.
Consistent Visual Language
Students should learn our visual conventions once and apply them repeatedly. Consistency reduces friction in understanding.
Balanced Accessibility
Visual diagrams should work for diverse learners. We design with accessibility in mind from the start.
Who?
The Chalk team includes passionate educators and technologists committed to improving visual learning tools.

Phil
Former teacher with interest in visualising historical change and stories.

Peyman
Experienced CTO with an interest in visualising organisation structures and mathematical concepts.

Umair
Experienced developer with a particular interest in visualising maths & philosophy.

Karl
Head of task design at Benton Park Primary and Year 6 teacher.


Bobi
Digital specialist and service design lead.
Want to learn more about how Chalk can transform your teaching?
Reach out to us at [email protected]